21 Multiple Linear Regression Analysis
At a glance
- Question
- How well do several predictors together predict a criterion, and what does each add?
- Design
- Correlational or experimental, several variables measured on the same participants
- Criterion
- Interval or ratio
- Predictors
- Two or more, continuous or coded categorical
- Assumptions
-
- Linear relationships, and a correctly specified model
- Predictors measured without error, and not too strongly related to each other
- Independent, normally distributed residuals with constant variance
- No influential cases (discrepancy, leverage, influence)
- Null hypothesis
- The model explains no variance (F); each slope is zero (t)
- Test statistic
- F for the model, t for each predictor
- Effect size
- R2 (and adjusted R2), and the standardized slopes, \beta
- If conditions fail
-
- Predictors are entered in steps, by theory → Hierarchical regression
- The criterion is dichotomous → Logistic regression
- Include in the write-up
-
- The assumption checks, and how unusual cases were handled
- R2, F(df1, df2) = …, p = …
- For each predictor: b, \beta, t, and p
Linear Regression is used to study/describe the predictive relationship between one criterion variable and one or more predictor variable(s). The procedure can be used to either explore the predictive relationships between a set of variables or to test a causal model. It can be applied when:
- The criterion variable is continuous;
- The predictor variable(s) is continuous, discrete or categorical.
It is a highly flexible procedure, especially helpful in non-experimental research in the social sciences field where researchers often deal with naturally occurring variables11 Variables measured as they naturally occur and are not manipulated in any way by the researchers.. The procedure allows researchers to determine if a given set of variables (predictors) is useful in predicting a criterion variable.
1 Variables measured as they naturally occur and are not manipulated in any way by the researchers.
The intent of the linear regression analysis is to find the best fitting line of a set of data points. Remember, the simple regression equation (see Simple Linear Regression) is of the form:
Y = a + bX
It is the equation representing a straight line in the two dimension plane. In this equation, Y is the criterion variable (the response), X is the predictor variable, a is the intercept22 The value of y when X = 0, or the point where the line intersects the Y (vertical) axis., and b is the slope of the line.
2 The value of y when X = 0, or the point where the line intersects the Y (vertical) axis.
Multiple linear regression expands on the simple linear regression model and attempts to account for how multiple predictors contribute to the value of the criterion variable. In this case the question has the form:
Y = a + b_1X_1 + b_2X_2 + ... + b_nX_n
Each predictor X_i has its own coefficient. With two predictors the equation no longer describes a line but a plane, and with more predictors a flat surface in more dimensions. The b_i coefficients represent the contributions of each individual predictor, while the other predictors are held constant. The intercept a is the value of Y when all the predictors are 0.
Multiple regression allows researchers to:
- Explore the relationship between the criterion variable and the predictor variables as a group and determine whether the relationships is statistically significant;
- Determine how much of the variance of the criterion variable can be accounted for by the predictors, individually and as a group;
- Determine the relative importance of the predictor variables.
Of note is the fact that regression analysis cannot provide strong evidence of a causal relationship between the variables but rather show that the findings are or are not consistent with the causal model under study33 The correlational nature of the data leads to multiple possible ways of interpreting the results.. In case of modeling causal relations, if none of the regression coefficients were found to be significant, the model failed to pass a test44 Alternatively, if significance was observed, the causal model passed an attempt at disconfirmation..
3 The correlational nature of the data leads to multiple possible ways of interpreting the results.
4 Alternatively, if significance was observed, the causal model passed an attempt at disconfirmation.
When designing the study researchers may not have sufficient knowledge to determine how the predictors affect the criterion variable. The model they build is their best guess based on their prior knowledge55 Based on existing literature, prior experience, other experiments they have conducted, etc. of the problem they are investigating. For this reason, to find the model that best represents the phenomena, regression analysis offers multiple pathways for conducting the analysis. This example looks at the enter, hierarchical, and backward regression models.
5 Based on existing literature, prior experience, other experiments they have conducted, etc.
The enter model includes all predictors while the stepwise regression forward and backwards models attempt to reach a more parsimonious (see Occam’s Razor for details) model by reducing the number of predictor variables while attempting to explain as much as possible of the criterion variable. The differences in the quality of the predicted scores can be studied by looking at the three models side by side. When the forward and backward models reach the same solution (regression equation), the result is more stable, but agreement between the two does not validate the model: both search the same data, and both can miss the model that best represents the phenomenon. The stepwise models are exploratory, a source of hypotheses for future studies rather than a confirmation. The hierarchical model, in turn, enters the predictors in blocks, in an order decided by the researcher, and tests what each block adds to the previous ones.
The enter model, as its name suggests, will include all predictors in the regression equation from the beginning. The forward model will enter the variables in the model one by one, starting with the predictor that has the highest order partial correlation with the criterion variable, and then calculating the regression statistics. The process continues by adding the remaining predictor variables, one by one, in descending order of their partial correlations with the criterion variable. This continues as long as the addition of a new predictor variable to the model improves its fit66 The goodness of fit of an estimated statistical model is measured by either the Akaike’s Information Criterion (AIC) or the Bayesian Information Criterion (BIC). The lower the value of AIC or BIC is, the better the model is. When the AIC/BIC of two successive models are compared, the model with the lower value is retained. AIC and BIC are not significance tests: there is no p-value for the difference. and its predictive power77 The predictive power of the model is reflected in the value of R2.. The backwards model starts with the full model88 The same model as the enter model. and continues by removing predictor variables one by one, in the reverse order of their partial correlation with the criterion variable. The process continues until the updated model does not improve on the previous one.
6 The goodness of fit of an estimated statistical model is measured by either the Akaike’s Information Criterion (AIC) or the Bayesian Information Criterion (BIC). The lower the value of AIC or BIC is, the better the model is. When the AIC/BIC of two successive models are compared, the model with the lower value is retained. AIC and BIC are not significance tests: there is no p-value for the difference.
7 The predictive power of the model is reflected in the value of R2.
8 The same model as the enter model.
Prior to the analysis we should familiarize ourselves with the data. Here are a few things to do to better understand what we are working with.
- Check for errors99 E.g., data entry, missing values, etc.;
9 E.g., data entry, missing values, etc.
- Outliers;
- Unusual distributions;
- Clustering or systematic patterns1010 If the data groups together in certain ways, forming areas where data is concentrated.;
10 If the data groups together in certain ways, forming areas where data is concentrated.
- Anything else unexpected.
21.1 Assumptions
In regression analysis assumptions are intertwined with the analysis itself. That is, some of the assumptions can only be verified once the model has been defined and after the analysis has been run and the results computed. Regression analysis assumptions are:
- Linear relationship between the predictor variables and the criterion variable
- Detected using plots of the residuals1111 The residual is the difference between the observed value of the criterion variable and the value predicted by the regression model. The mean of residuals is zero, as is their sum. Residuals help us understand how well the regression line (equation) approximates the data from which it was generated. against each continuous predictor and predictive values;
11 The residual is the difference between the observed value of the criterion variable and the value predicted by the regression model. The mean of residuals is zero, as is their sum. Residuals help us understand how well the regression line (equation) approximates the data from which it was generated.
- The assumption is violated when large or systematic deviations of the fit line are observed around the 0-line1212 Representing the mean of the residuals.. A violation is indicative of a non-linear relationship.
12 Representing the mean of the residuals.
- Detected using plots of the residuals1111 The residual is the difference between the observed value of the criterion variable and the value predicted by the regression model. The mean of residuals is zero, as is their sum. Residuals help us understand how well the regression line (equation) approximates the data from which it was generated. against each continuous predictor and predictive values;
- Correct model specification
- Detected by performing the R Squared Change test to determine if adding a variable (given that the theoretical model supports it) to the regression model significantly increases R Square.
- If the R Square Change test is significant, the variable should be included in the regression model. Otherwise, if the test is not significant, do not include the variable.
- No measurement error in the predictor variables
- Detected by examining the reliability coefficients for the predictor variables;
- Inadequate reliability if the coefficients are less than .70. Even above .70 some measurement error remains, and it weakens the estimated coefficients.
- Homoscedasticity, residuals have constant variance
- Detected by plotting the residuals against each continuous predictor and predicted values;
- Relationship between variability of the residuals and either the predictor variables or the predicted values indicate heteroscedasticity.
- Residuals are independent, reflecting a clustering or serial dependency problem
- Clustering is detected by using plots of residuals against the grouping/cluster variable using Box Plots;
- The clustering assumption is violated if there is variability in the median value of the residuals in each group;
- Serial dependency is detected by looking at the measure of autocorrelation using the Durbin-Watson test;
- Values close to 2 indicate no autocorrelation. The serial dependency assumption is violated when the value is far from 2, toward 0 or 4, and the Durbin-Watson test is significant.
- Clustering is detected by using plots of residuals against the grouping/cluster variable using Box Plots;
- Normal distribution of residuals1313 In case of linear regression, a plot of residuals should look as a random cloud of points alongside the regression line. If a pattern is observed in how the residuals are arranged (e.g., they seem to align along a curve), it may be an indication that a non-linear model may be a better fit.
13 In case of linear regression, a plot of residuals should look as a random cloud of points alongside the regression line. If a pattern is observed in how the residuals are arranged (e.g., they seem to align along a curve), it may be an indication that a non-linear model may be a better fit.
- Detected by using normal probability plots and histogram plots of residuals;
- Non-normal distribution of residuals indicate a violation;
- Residuals that fall far from the straight line indicate a violation.
21.2 The Study
A study was conducted in a Midwestern state in the US to gauge consumers’ interest in purchasing and consuming the different kinds of nuts1414 Chestnuts, pecans, and black walnuts. available on the market. The primary focus of the study was to attempt to predict future market behavior based on consumption of, familiarity with, and interest in the product. The data was collected using a survey-type instrument. With the exception of demographic data, the questions used 5-point Likert scales.
14 Chestnuts, pecans, and black walnuts.
For the purpose of this analysis, three variables, defined from the raw dataset, were chosen:
- Interest in buying raw nuts from farmers markets or grocery stores;
- Interest in buying prepared/semi prepared products that contain nuts at farmers markets or from grocery stores;
- Interest in consuming, in restaurants, prepared food that contains nuts;
The questionnaire was freely distributed during a local festival. A number of 232 responses were collected.
Hypotheses. The analysis below models the interest in buying raw nuts (BuyRaw) as a function of six predictors: price, quality, taste, being locally grown, ease of preparation, and nutrition.
- Null hypothesis (H0): Taken together, the predictors explain none of the variance in the interest in buying raw nuts. All regression coefficients are zero (b_{1} = b_{2} = ... = b_{6} = 0).
- Alternative hypothesis (H1): At least one regression coefficient is different from zero. That is, the predictors explain part of the variance in the interest in buying raw nuts.
Decision criteria. The significance level is set at \alpha = .05. The model as a whole is tested with an F test, and H0 is rejected if its p-value is smaller than \alpha. Each coefficient is then tested with a t-Test at the same level, to see which predictors contribute to the model.
21.3 Preliminary Steps
For all quantitative studies is always helpful to familiarize yourself with the data, how it looks, etc. So, let’s look at the first few lines of the dataset1515 Due to the large number of variables, only the firs 10 are shown..
15 Due to the large number of variables, only the firs 10 are shown.
| D1.1 | D2.1 | D3.1 | F1.1 | F1.2 | F1.3 | F1.4 | F1.5 | F1.6 | F2.1 |
|---|---|---|---|---|---|---|---|---|---|
| 3 | 4 | 4 | 3 | 4 | 4 | 5 | 4 | 3 | 3 |
| 2 | 3 | 2 | 3 | 5 | 5 | 2 | 2 | 4 | 4 |
| 3 | 5 | 5 | 1 | 1 | 1 | 1 | 1 | 1 | 3 |
| 2 | 2 | 1 | 2 | 3 | 4 | 3 | 3 | 2 | 2 |
| 1 | 1 | 1 | 2 | 5 | 5 | 4 | 5 | 5 | 2 |
| 1 | 1 | 1 | 2 | 2 | 2 | 1 | 1 | 1 | 3 |
21.3.1 Missing Cases
Due to the large sample available, for the purpose of this example, the cases with missing variables were deleted list wise.
21.3.2 Variable Recoding
| Name | Type | Value Range | Description |
|---|---|---|---|
| BuyRaw | DV | 3-15 | Interest in buying raw nuts |
| Price | IV | 3-15 | How much the product's price influences purchase/consumption decision |
| Quality | IV | 3-15 | How much the product's quality influences purchase/consumption decision |
| Taste | IV | 3-15 | How much the product's taste influences purchase/consumption decision |
| LocGrown | IV | 3-15 | How much the fact that the product is locally grown influences purchase/consumption decision |
| PrepEase | IV | 3-15 | How much product's ease of preparation influences purchase/consumption decision |
| Nutrition | IV | 3-15 | How much product's nutrition factor influences purchase/consumption decision |
The survey was designed to enable a detailed study of the market, for which reason the questions used to collect the data were divided between the three categories of products: chestnuts, pecans, and black walnuts. To capture an overall view of the market the three categories are merged into a single variable. This example analysis will look at the following variables (Table 21.21616 The value of a variable for all the variables listed in Table 21.2 is determined by summing the scores of three questions together. Therefore, if the Likert scale used is from 1 to 5, the minimum value is 3 and the maximum is 15.):
16 The value of a variable for all the variables listed in Table 21.2 is determined by summing the scores of three questions together. Therefore, if the Likert scale used is from 1 to 5, the minimum value is 3 and the maximum is 15.
The new variables described in Table 21.2 are computed, using an addition-based model, based on the participants’ responses to survey questions (Table 21.3). Table 21.4 shows a few lines showing the newly created variables.
| Variable | Component Questions |
|---|---|
| BuyRaw | D1.1 + D2.1 + D3.1 |
| Price | F1.1 + F2.1 + F3.1 |
| Quality | F1.2 + F2.2 + F3.2 |
| Taste | F1.3 + F2.3 + F3.3 |
| LocGrown | F1.4 + F2.4 + F3.4 |
| PrepEase | F1.5 + F2.5 + F3.5 |
| Nutrition | F1.6 + F2.6 + F3.6 |
| BuyRaw | Price | Quality | Taste | LocGrown | PrepEase | Nutrition |
|---|---|---|---|---|---|---|
| 11 | 9 | 12 | 12 | 15 | 10 | 9 |
| 7 | 11 | 13 | 13 | 6 | 6 | 12 |
| 13 | 9 | 11 | 11 | 11 | 11 | 11 |
| 5 | 6 | 9 | 13 | 9 | 9 | 6 |
| 3 | 6 | 15 | 14 | 13 | 15 | 15 |
| 3 | 6 | 6 | 6 | 3 | 3 | 5 |
21.4 Summary Statistics
As a first attempt to discover any possible abnormalities in the data it is always helpful to run summary statistics on the variables in the dataset.
A cursory analysis of the data in Table 21.5 shows that there are no unexpected problems with the data. For example, for all variables the number of included cases is the same (184), meaning that there are no missing cases, the min (3) and max (15) represents the correct range determined by the way the variables were computed (Tables 21.3 and 21.4).
| vars | n | mean | sd | median | trimmed | mad | min | max | range | skew | kurtosis | se | |
|---|---|---|---|---|---|---|---|---|---|---|---|---|---|
| BuyRaw | 1 | 184 | 9.108696 | 3.120377 | 9.0 | 9.121622 | 2.9652 | 3 | 15 | 12 | -0.1057655 | -0.5286221 | 0.2300373 |
| Price | 2 | 184 | 9.277174 | 2.591352 | 9.0 | 9.324324 | 2.9652 | 3 | 15 | 12 | -0.1676375 | 0.0789947 | 0.1910370 |
| Quality | 3 | 184 | 11.206522 | 2.929175 | 12.0 | 11.506757 | 2.9652 | 3 | 15 | 12 | -0.8162024 | 0.3883894 | 0.2159417 |
| Taste | 4 | 184 | 11.635870 | 2.931461 | 12.0 | 11.986486 | 2.9652 | 3 | 15 | 12 | -0.8755188 | 0.4133036 | 0.2161101 |
| LocGrown | 5 | 184 | 9.923913 | 3.244950 | 10.0 | 10.040541 | 2.9652 | 3 | 15 | 12 | -0.3063596 | -0.5387937 | 0.2392209 |
| PrepEase | 6 | 184 | 10.114130 | 3.034054 | 10.0 | 10.250000 | 2.9652 | 3 | 15 | 12 | -0.4631285 | -0.2138948 | 0.2236734 |
| Nutrition | 7 | 184 | 10.663044 | 3.477570 | 11.5 | 10.945946 | 3.7065 | 3 | 15 | 12 | -0.4941394 | -0.6215137 | 0.2563698 |
Before moving forward we need to define the full regression model as the decision to buy as a function of price, quality, taste, growth place, ease of preparation, and nutrition qualities. It can be represented as a linear relationship of the study’s predictors:
\begin{array}{c} BuyRaw'=b_{0}+b_{1}\cdot Price+b_{2}\cdot Quality+b_{3}\cdot Taste\\ +b_{4}\cdot LocGrown+b_{5}\cdot PrepEase+b_{6}\cdot Nutrition \end{array}
21.5 Unusual Cases: Discrepancy, Leverage, and Influence
A few unusual cases can change the results of a regression considerably. Not every unusual case is a problem, though, and it helps to distinguish three properties of a case1717 See also the Outliers section of Assumptions and Outliers.:
17 See also the Outliers section of Assumptions and Outliers.
- Discrepancy: how far the case is from the regression surface, in the direction of the criterion. A case with a large residual is an outlier;
- Leverage: how far the case is from the other cases in the values of the predictors. A case with an unusual combination of predictor values has high leverage. It has the potential to pull the regression surface toward itself;
- Influence: how much the results change when the case is removed. Influence is the combination of discrepancy and leverage. A case is influential when it has high leverage and does not follow the pattern of the other cases.
A case with a large residual but low leverage changes the intercept a little and the slopes hardly at all. A case with high leverage that lies on the regression surface changes nothing; it even makes the estimates more precise. Only the combination of the two is a concern.
21.5.1 Discrepancy
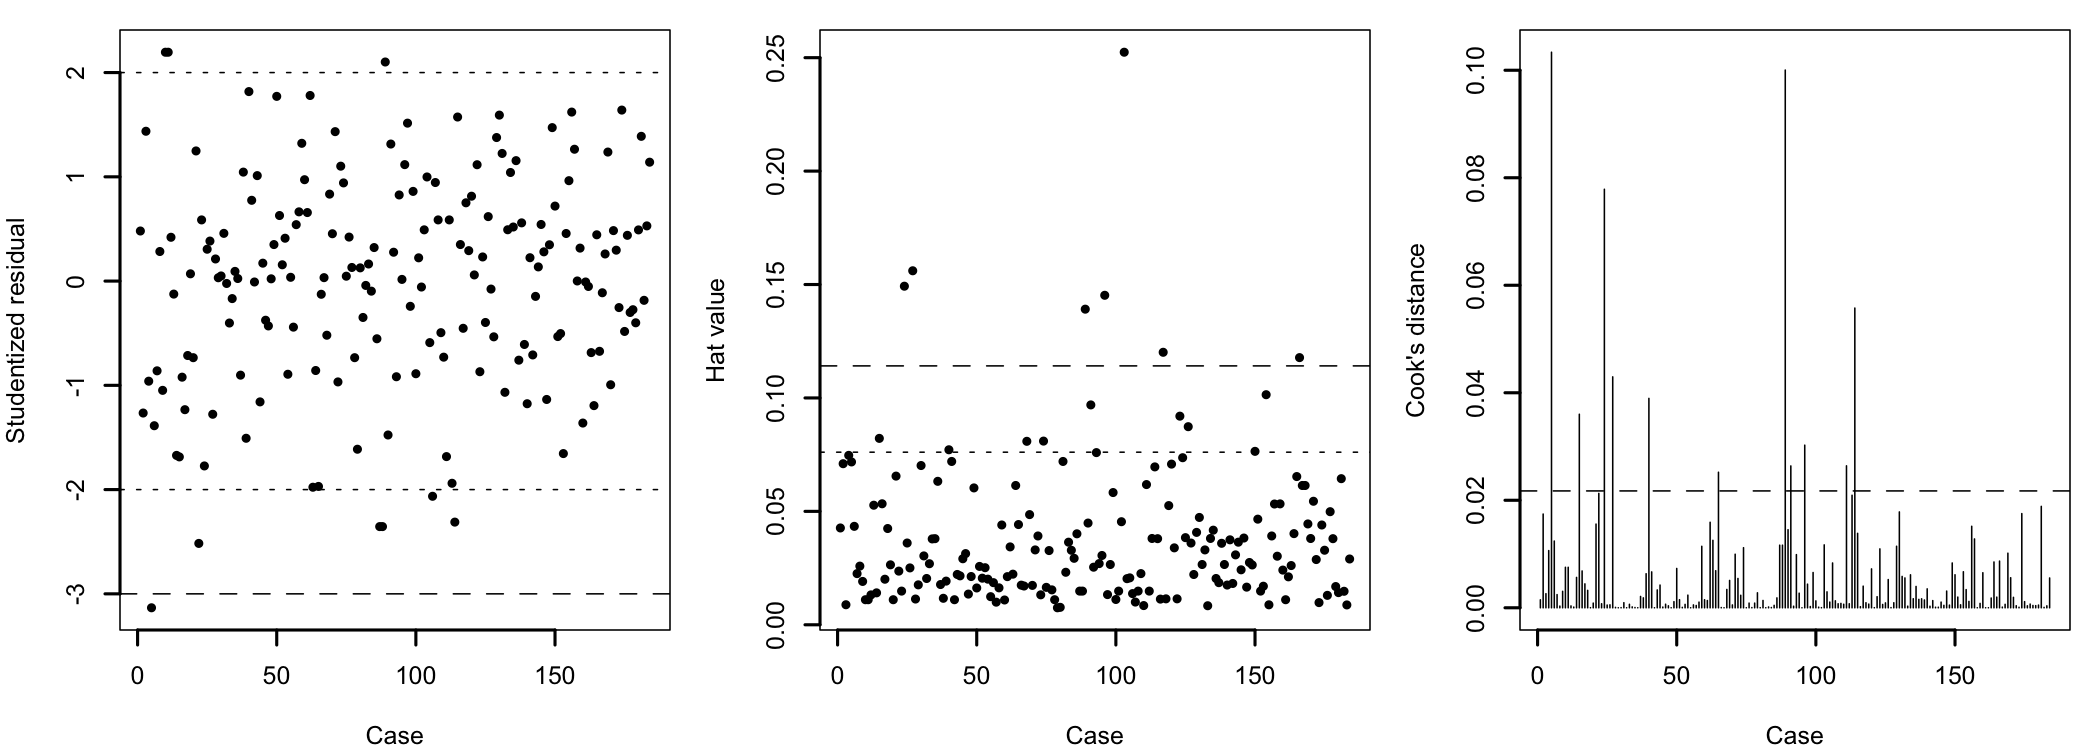
The raw residuals are expressed in the units of the criterion, and their size depends on how unusual the case is. The studentized residuals1818 Also called deleted or externally studentized residuals. solve both problems: each residual is divided by its standard error, computed from a model that leaves the case out. In a sample with normally distributed residuals, about 95% of the studentized residuals are between -2 and 2, and values beyond \pm 3 are rare. With 184 cases, however, a few values beyond \pm 2 are expected by chance alone. The Bonferroni outlier test takes the number of cases into account and tests the largest studentized residual.
18 Also called deleted or externally studentized residuals.
        5        23       108
-3.133652 -2.516261 -2.354964
No Studentized residuals with Bonferroni p < 0.05
Largest |rstudent|:
rstudent unadjusted p-value Bonferroni p
5 -3.133652 0.0020229 0.37222The largest studentized residual, -3.13 (case 5), is not significant once the number of cases is taken into account (Bonferroni p = .372). There are no clear outliers in the data.
21.5.2 Leverage
Leverage is measured by the hat values, h_i, which range from 1/n to 1. Their mean is (k + 1)/n, where k is the number of predictors, and values more than two or three times the mean deserve attention. Here the mean is (6 + 1) / 184 = 0.038, and the two thresholds are 0.076 and 0.1141919 The hat values are closely related to the Mahalanobis distances of the cases from the centroid of the predictors, h_i = MD_i/(n - 1) + 1/n. The Mahalanobis distance is the distance between a case and the point where the means of all predictors intersect (the centroid), taking the correlations between the predictors into account..
19 The hat values are closely related to the Mahalanobis distances of the cases from the centroid of the predictors, h_i = MD_i/(n - 1) + 1/n. The Mahalanobis distance is the distance between a case and the point where the means of all predictors intersect (the centroid), taking the correlations between the predictors into account.
   26    29   110   121   129   145   206
0.149 0.156 0.139 0.145 0.252 0.120 0.118
16 cases are above the lower threshold and 7 above the higher one. These are participants who answered the questions about the factors that influence their decisions in an unusual combination2020 For example, rating price as very important and quality as unimportant.. They have the potential to influence the results, if their interest in buying raw nuts does not follow the pattern of the other participants.
20 For example, rating price as very important and quality as unimportant.
21.5.3 Influence
Cook’s distance (D_i) measures the influence of a case on all the coefficients of the model at once. It combines the size of the residual with the leverage of the case:
D_i = \frac{e_i^{*2}}{k + 1} \times \frac{h_i}{1 - h_i}
where e_i^* is the standardized residual. A value larger than 1 indicates a case that changes the results substantially when removed. A more sensitive threshold, 4/n, flags the cases worth examining. The DFBETAS measure the influence of a case on each coefficient separately: by how many standard errors the coefficient changes when the case is removed. Values larger than 2/\sqrt{n} are worth examining.
         5        110         26        142         29
0.10335336 0.10003076 0.07785718 0.05575538 0.04295755
[1] 0No case has a Cook’s distance near 1: the largest is 0.103 (Figure 21.1). 11 cases are above the sensitive threshold of 4/184 = 0.022, and the three most influential are cases 5, 110, 26. The DFBETAS tell a similar story: 41 cases change at least one coefficient by more than the sensitive threshold of 2/\sqrt{184} = 0.15 standard errors, but none of them by more than one standard error (0 cases).
To see what the most influential cases do, let’s fit the model again without the three cases with the largest Cook’s distances and compare the coefficients:
               All Without
(Intercept)  3.940   4.012
Price       -0.061  -0.127
Quality      0.474   0.503
Taste       -0.040  -0.028
LocGrown     0.091   0.123
PrepEase    -0.172  -0.128
Nutrition    0.163   0.101
The coefficients change somewhat, but their signs and the overall picture stay the same, and Quality remains the only predictor with a large coefficient. The results do not depend on a few cases, and all cases are kept in the analysis.
Removing cases is justified when they are errors2121 For example, a value entered incorrectly, or a participant who did not understand the questions. or when they do not belong to the population studied. Removing valid cases only because they are unusual makes the results look better than they are, and should be avoided2222 When influential cases are kept, the analysis can also be reported both with and without them, so that readers can judge their impact..
21 For example, a value entered incorrectly, or a participant who did not understand the questions.
22 When influential cases are kept, the analysis can also be reported both with and without them, so that readers can judge their impact.
21.6 Residuals Analysis
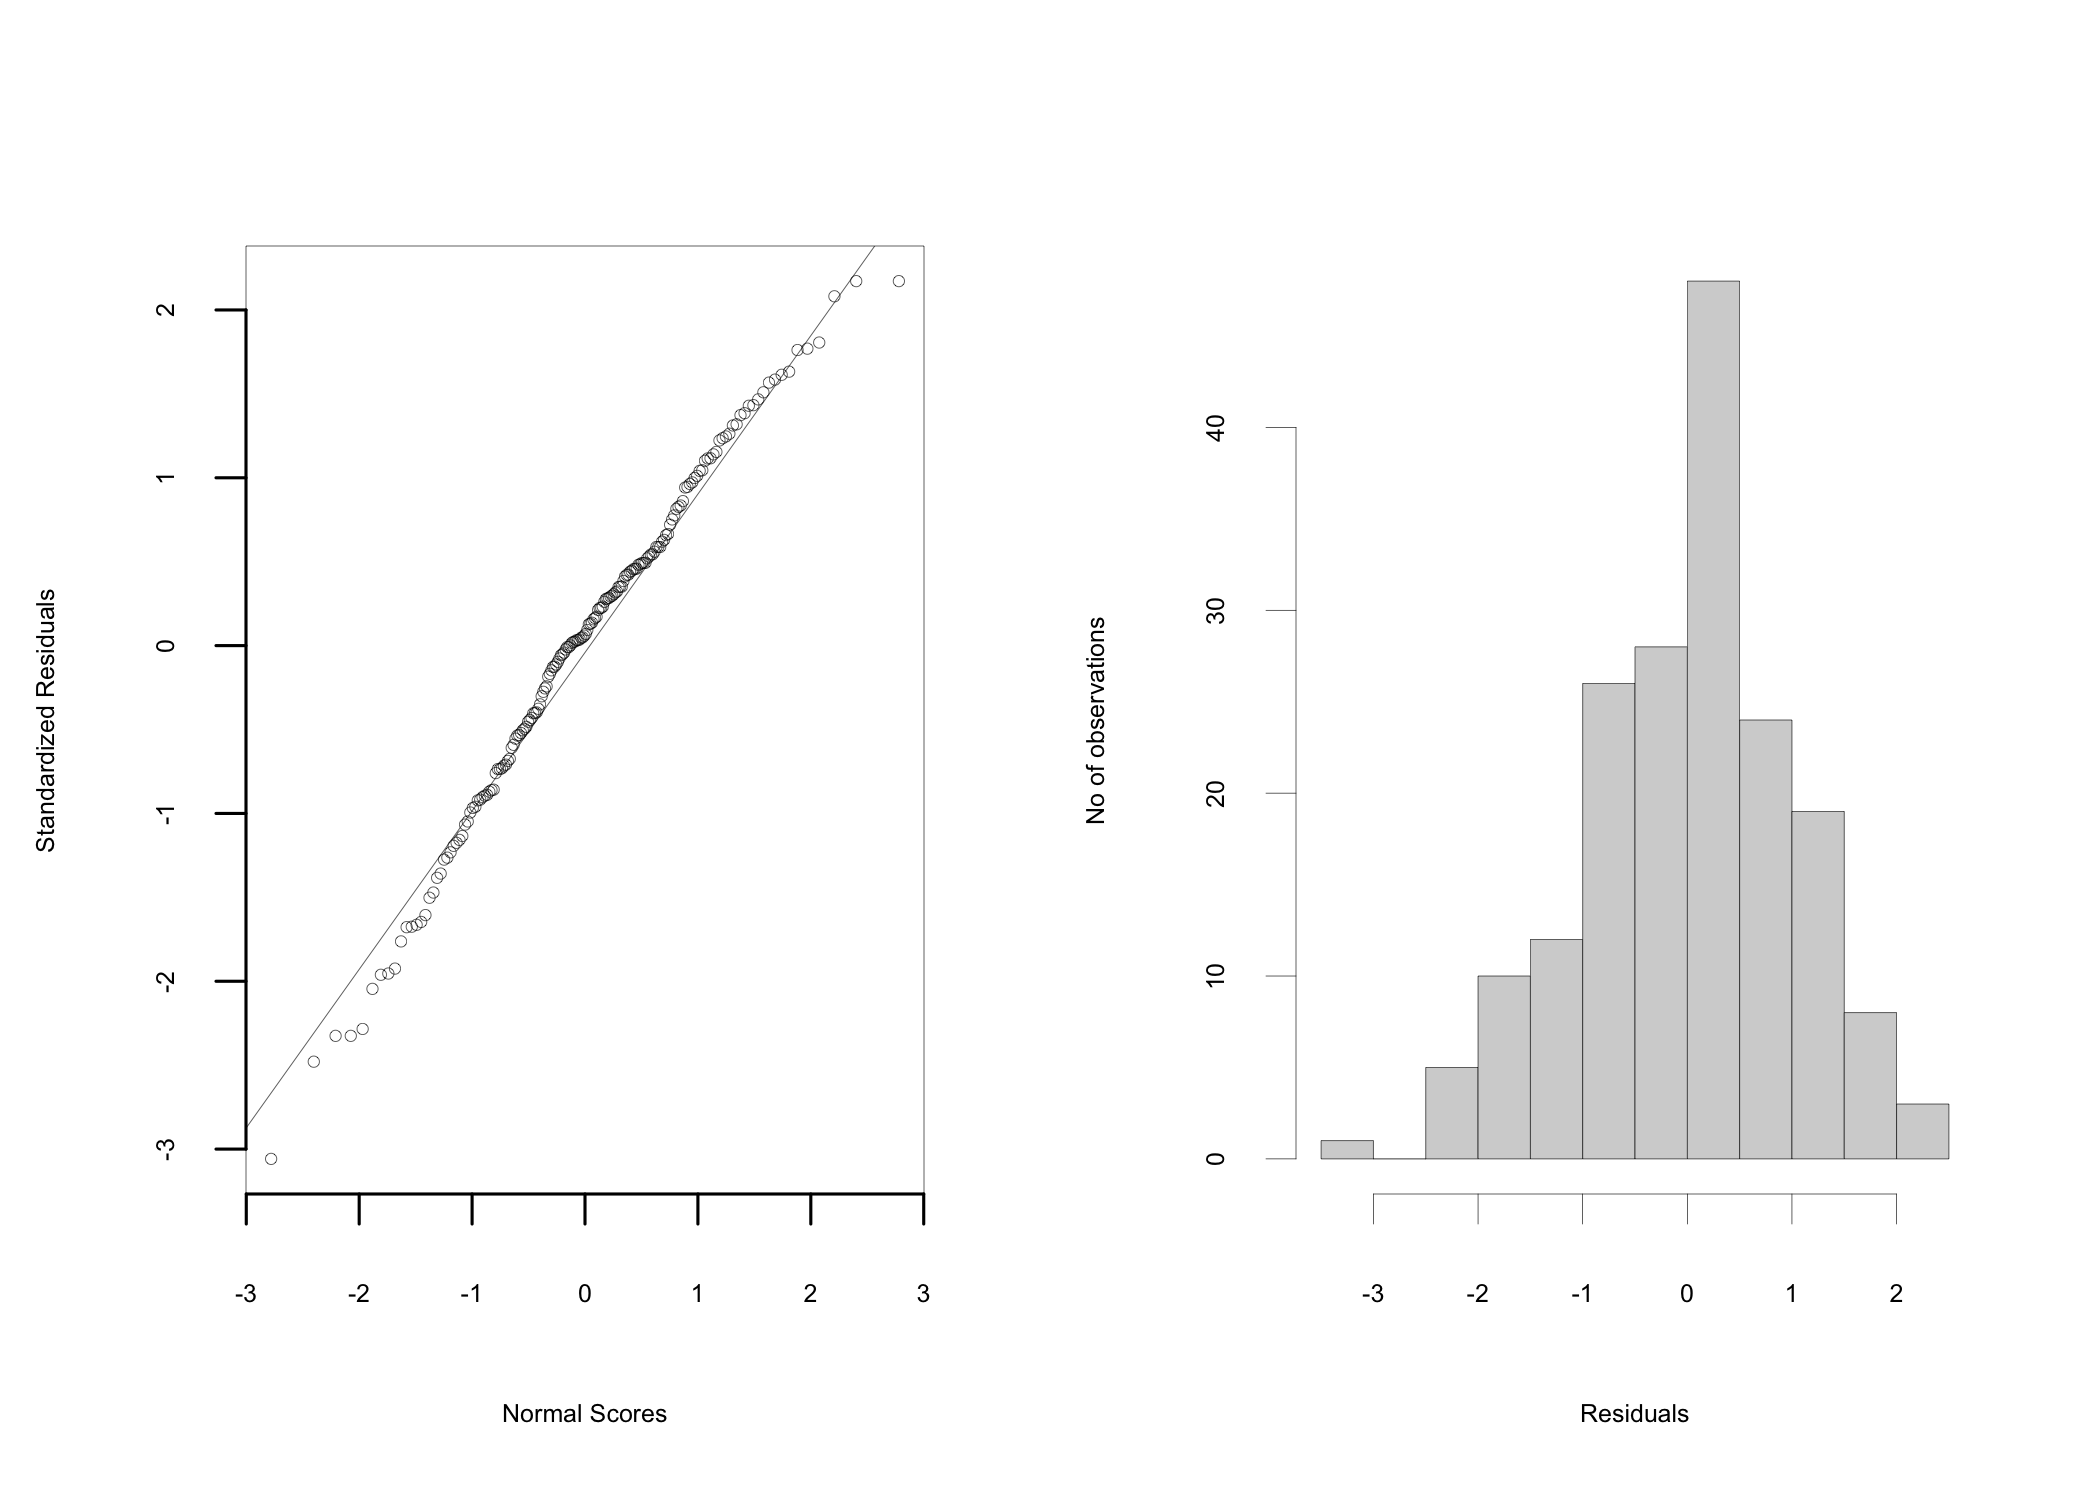
Multiple regression analysis assumes linear relationships between the variables included in the equation and the normal distribution of residuals. When these assumptions are violated, the final conclusion drawn may not be accurate. Normal probability plots are used to test these assumptions (Figure 21.2 left). The grouping of the points close to the straight line2323 The representation is a quantile-quantile plot and is interpreted similarly. supports the assumption that the residuals are normally distributed. The same assumption is also supported by the histogram representation of the residuals (Figure 21.2 right).
23 The representation is a quantile-quantile plot and is interpreted similarly.
21.7 Linearity
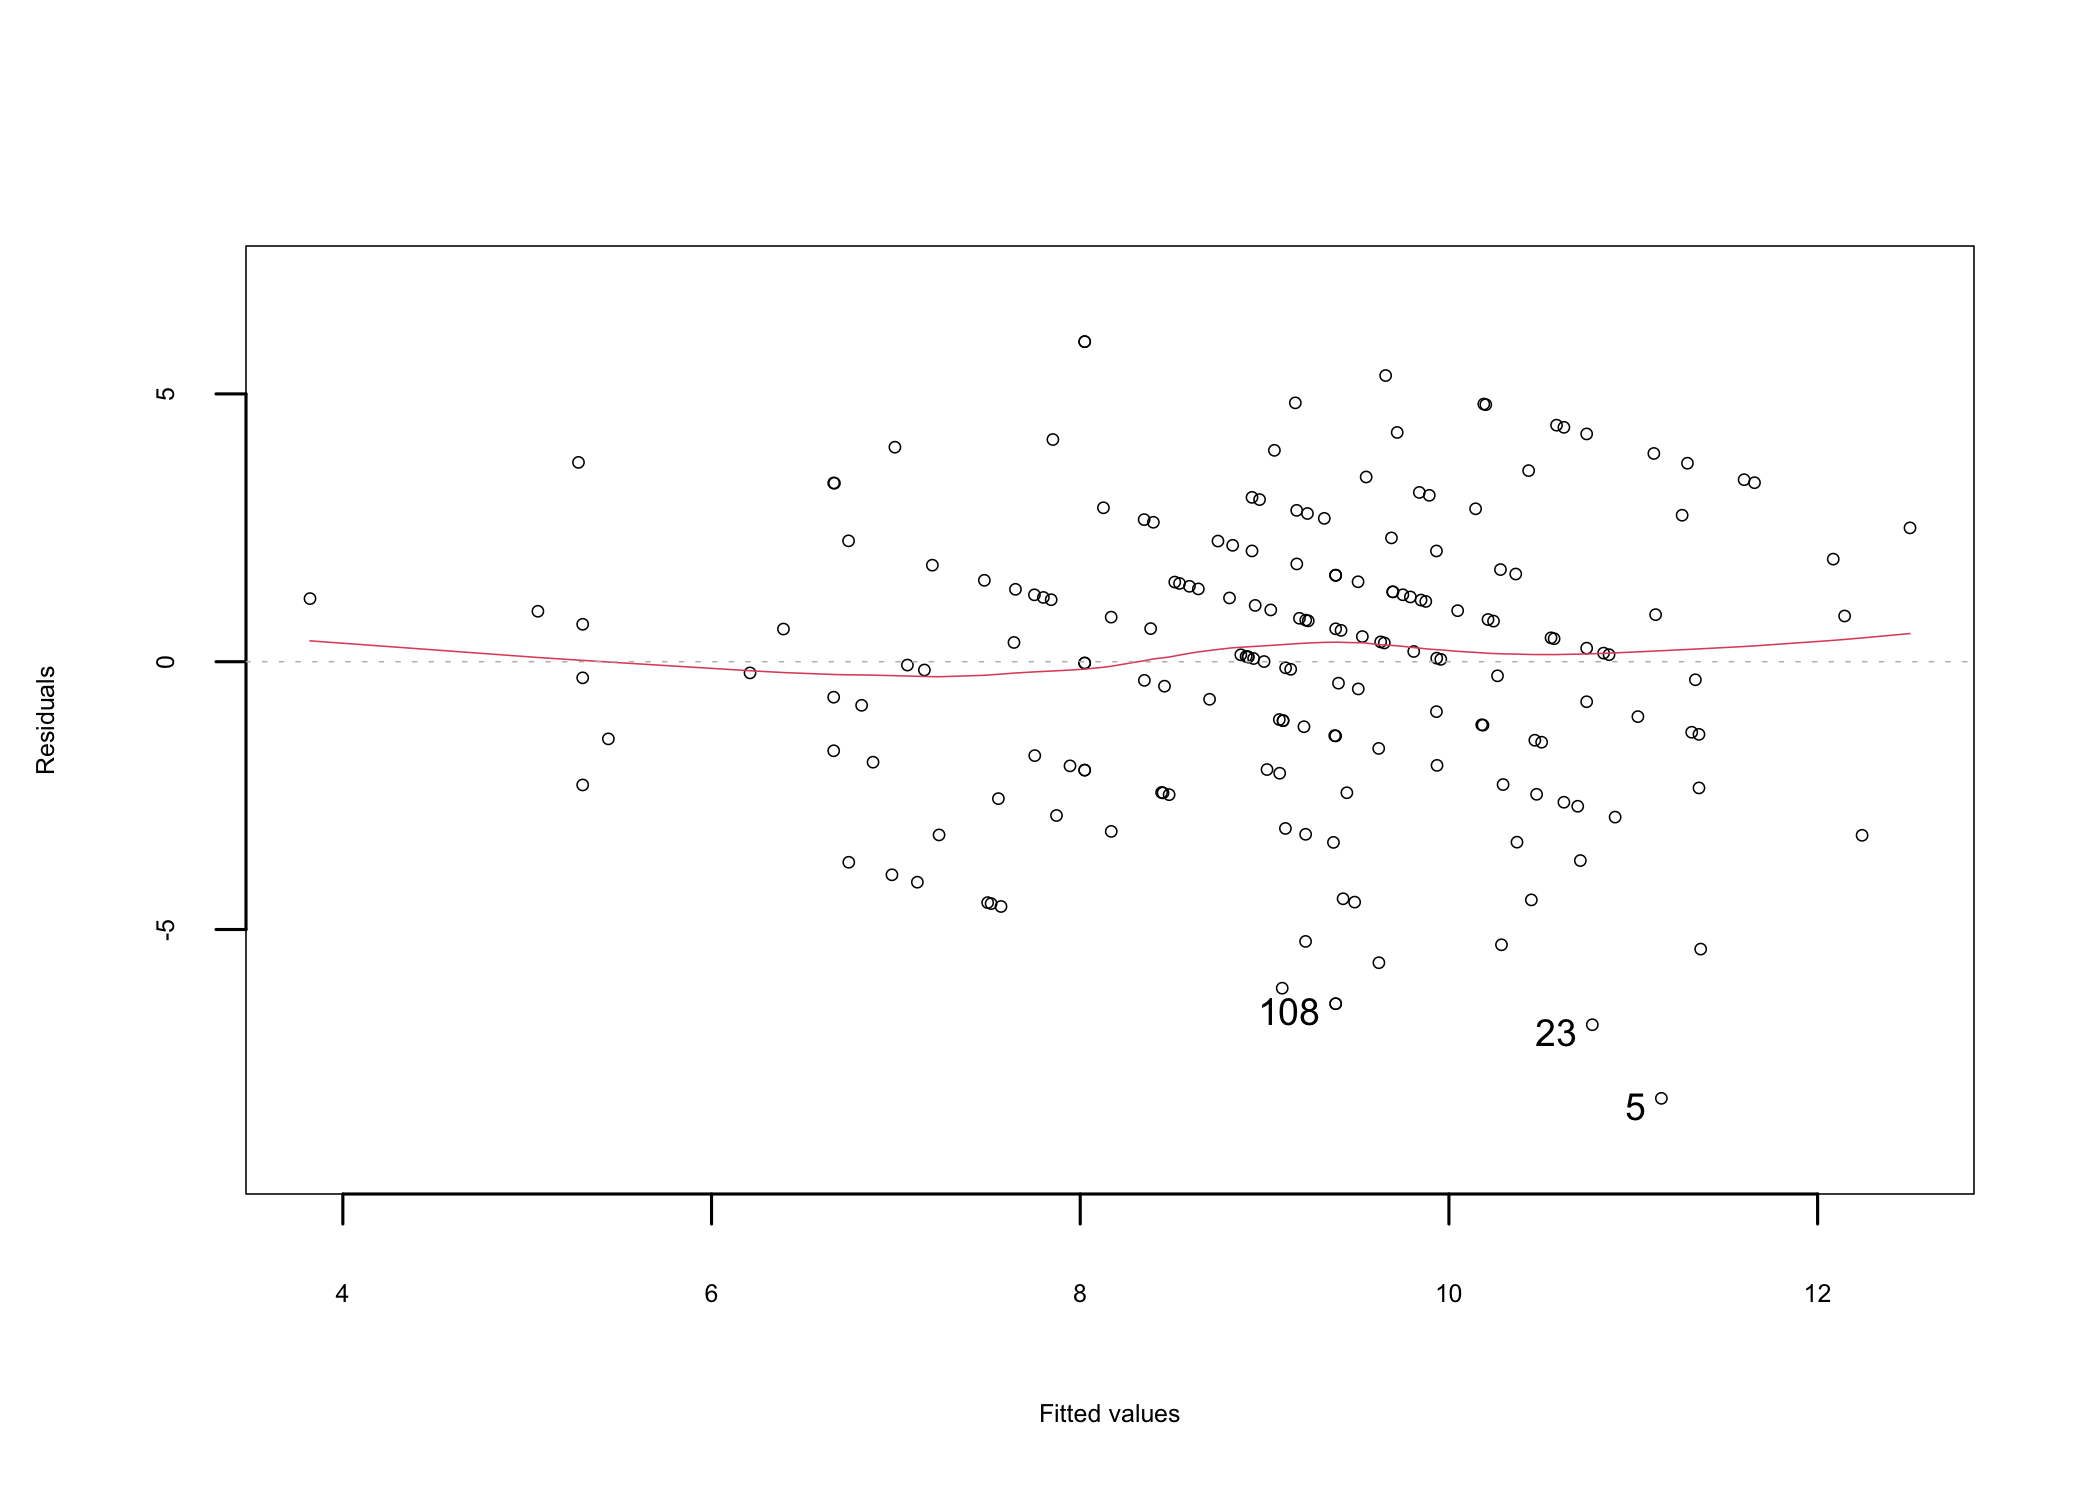
A simple residuals vs fitted plot can be used to test the linearity assumption (Figure 21.3). If linearity is observed, the data points plotted on the graph should resemble a homogeneous cloud around the center line, which should be approximately horizontal at zero. Alternatively, a pattern is indicative of a problem with the linear model. In this analysis, the distribution of the points and the center line (red) suggest that a linear relationship between the criterion and predictor variables can be assumed.
21.8 Enter or Full Model
Up to this point the preliminary analysis of the assumptions has been conducted using the full regression model, which includes all predictor variables. As a reminder, the regression equation for the enter model is2424 BuyRaw’ is the estimated value of the criterion variable.:
24 BuyRaw’ is the estimated value of the criterion variable.
\begin{array}{c} BuyRaw'=b_{0}+b_{1}\cdot Price+b_{2}\cdot Quality+b_{3}\cdot Taste\\ +b_{4}\cdot LocGrown+b_{5}\cdot PrepEase+b_{6}\cdot Nutrition \end{array}
In regression analysis the correlations should be high between the criterion and predictor variables and low between predictor variables. There are multiple ways to look at the correlations between the predictor variables and a wide variety of graphical representations to help the analysis. For example, a visualization of the variable correlations is shown in Figure 21.4.
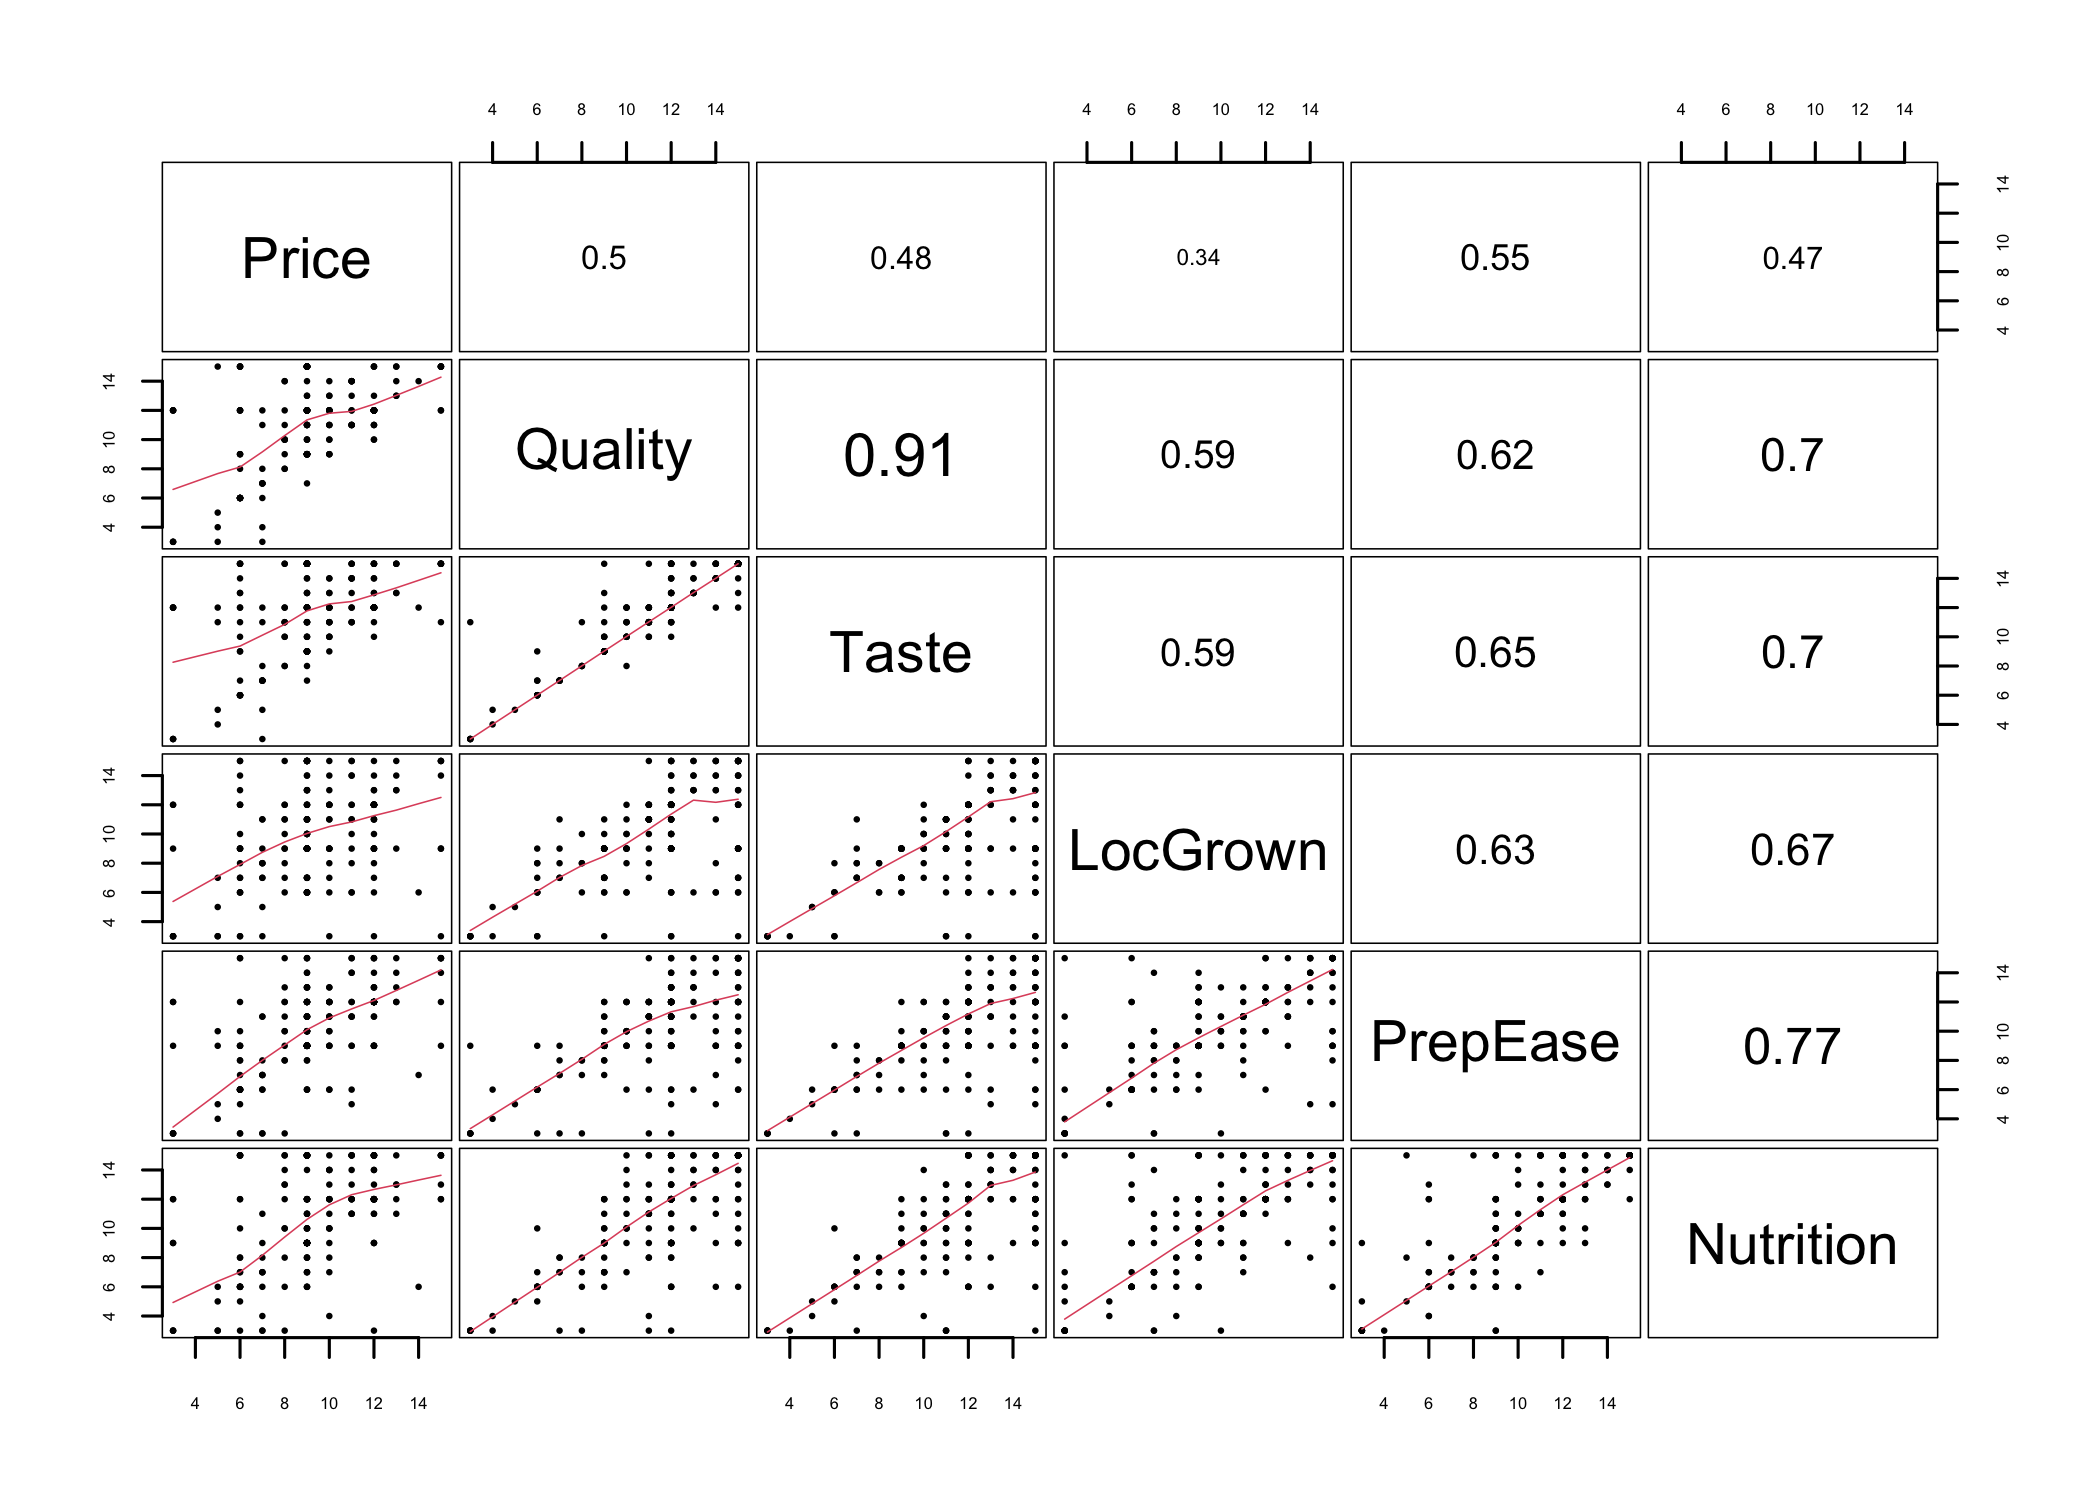
Figure 21.4 shows the predictors on the diagonal, the value of the correlation coefficient between each pair of two predictors above the diagonal, with larger font for higher correlations, and a scatter plot of each pair below the diagonal. The numerical values of the correlation coefficients are fairly easy to interpret. The closer the value is to 1, the higher the correlation is. The closer the value is to 0, the lower the correlation is. Therefore, we are looking to have low values across the board. In this case, quality is highly correlated to taste, as indicated by the value of correlations coefficient of 0.91.
Looking at the scatter plots below the diagonal, we want to see the data points distributed across the plot area rather than forming a pattern. Looking at the same two variables as discussed above, the scatterplot representation shows the points arranged close to and alongside the red diagonal line, forming a diagonal pattern. Other scatter plots may look more distributed, but a closer inspection shows that in some of them the many of the points are concentrated in a pattern along the red diagonal line.
A table representation of the correlations coefficients between the variables in the study (Table 21.6) may be more helpful, especially when it is associated with a table showing the significance levels (Table 21.7) of these correlations.
| BuyRaw | Price | Quality | Taste | LocGrown | PrepEase | Nutrition | |
|---|---|---|---|---|---|---|---|
| BuyRaw | 1.00 | 0.18 | 0.47 | 0.41 | 0.33 | 0.25 | 0.38 |
| Price | 0.18 | 1.00 | 0.50 | 0.48 | 0.34 | 0.55 | 0.47 |
| Quality | 0.47 | 0.50 | 1.00 | 0.91 | 0.59 | 0.62 | 0.70 |
| Taste | 0.41 | 0.48 | 0.91 | 1.00 | 0.59 | 0.65 | 0.70 |
| LocGrown | 0.33 | 0.34 | 0.59 | 0.59 | 1.00 | 0.63 | 0.67 |
| PrepEase | 0.25 | 0.55 | 0.62 | 0.65 | 0.63 | 1.00 | 0.77 |
| Nutrition | 0.38 | 0.47 | 0.70 | 0.70 | 0.67 | 0.77 | 1.00 |
The data in Table 21.6 suggests that the higher correlations between the criterion variable BuyRaw and any of the predictor variables is with Quality, at 0.47.
| BuyRaw | Price | Quality | Taste | LocGrown | PrepEase | Nutrition | |
|---|---|---|---|---|---|---|---|
| BuyRaw | NA | 0.015 | 0 | 0 | 0 | 0.001 | 0 |
| Price | 0.015 | NA | 0 | 0 | 0 | 0.000 | 0 |
| Quality | 0.000 | 0.000 | NA | 0 | 0 | 0.000 | 0 |
| Taste | 0.000 | 0.000 | 0 | NA | 0 | 0.000 | 0 |
| LocGrown | 0.000 | 0.000 | 0 | 0 | NA | 0.000 | 0 |
| PrepEase | 0.001 | 0.000 | 0 | 0 | 0 | NA | 0 |
| Nutrition | 0.000 | 0.000 | 0 | 0 | 0 | 0.000 | NA |
Looking at the correlations between the predictor variables (Table 21.6) the the associated p-values2525 Significance levels of correlations (Table 21.7) it appears that this data set has a problem. The correlations between predictors are relatively high, for which reason their contribution is overlapping.
25 Significance levels of correlations
It has become evident at this point that the dataset has problems. Nevertheless, the analysis can still be conducted to inform next steps. With this knowledge, let’s look at the results of the regression analysis.
Call:
lm(formula = BuyRaw ~ Price + Quality + Taste + LocGrown + PrepEase +
    Nutrition, data = my.chestnut)

Residuals:
   Min     1Q Median     3Q    Max
-8.152 -1.784  0.176  1.620  5.976

Coefficients:
            Estimate Standardized Std. Error t value Pr(>|t|)
(Intercept)  3.93956           NA    0.94055   4.189 4.42e-05 ***
Price       -0.06074     -0.05044    0.09802  -0.620   0.5363
Quality      0.47363      0.44460    0.17539   2.700   0.0076 **
Taste       -0.04037     -0.03792    0.17374  -0.232   0.8165
LocGrown     0.09087      0.09450    0.08928   1.018   0.3102
PrepEase    -0.17247     -0.16770    0.11791  -1.463   0.1453
Nutrition    0.16292      0.18157    0.10811   1.507   0.1336
---
Signif. codes:  0 '***' 0.001 '**' 0.01 '*' 0.05 '.' 0.1 ' ' 1

Residual standard error: 2.767 on 177 degrees of freedom
Multiple R-squared:  0.2396,    Adjusted R-squared:  0.2138
F-statistic: 9.294 on 6 and 177 DF,  p-value: 7.425e-09
The explanatory power of this regression model is indicated by the value of R2 = 0.2402626 The value is computed together with the other parameters and made available in the output. In this case (R output) it is in the notes at the bottom, the line titled “Multiple R-squared”. The adjusted R2, 0.214, corrects it for the number of predictors. which tells us that the current model accounts for 24.0% of the variance of the criterion variable. The regression coefficients2727 The values that represent the b coefficients in the regression equation. can be found in the column labeled Estimate. Using these coefficients, the regression equation is:
26 The value is computed together with the other parameters and made available in the output. In this case (R output) it is in the notes at the bottom, the line titled “Multiple R-squared”. The adjusted R2, 0.214, corrects it for the number of predictors.
27 The values that represent the b coefficients in the regression equation.
\begin{array}{c} BuyRaw'=3.9396 -0.0607\cdot Price +0.4736\cdot Quality -0.0404\cdot Taste\\ +0.0909\cdot LocGrown -0.1725\cdot PrepEase +0.1629\cdot Nutrition \end{array}
Standardized \beta (beta) coefficients (the Standardized column in the output) are an indication of the relative importance of the respective predictor variable in predicting the value of the criterion variable. To help us understand which of the regression coefficients may be relevant, t-Tests are run behind the scenes to determine the significance2828 If the coefficient is significantly different than 0. of each b coefficient in the regression equation. In this example the last column of the output2929 The column titled Pr(>|t|) lists the significance (p-value) of the coefficients. The asterisks indicate the level of significance based on legends shown in theSignif. codes line below the table. shows that only the Quality predictor variable is significant at a level of significance of 0.05.
28 If the coefficient is significantly different than 0.
29 The column titled Pr(>|t|) lists the significance (p-value) of the coefficients. The asterisks indicate the level of significance based on legends shown in theSignif. codes line below the table.
The last line of the regression analysis output shows the results of the ANOVA test if the model has a significant explanatory power3030 The ANVOA test is run to determine if the null hypothesis holding that all coefficients are 0 holds or not. If this null hypothesis can be safely rejected (p < 0.05), then the regression model defined in the analysis has a significant explanatory power..
30 The ANVOA test is run to determine if the null hypothesis holding that all coefficients are 0 holds or not. If this null hypothesis can be safely rejected (p < 0.05), then the regression model defined in the analysis has a significant explanatory power.
Decision. With F(6, 177) = 9.29, p < .001, the p-value is smaller than \alpha = .05 and H0 is rejected: the model is significant, and the predictors together explain part of the variance in the interest in buying raw nuts. Of the individual coefficients, only Quality is significant at \alpha = .05.
Effect size. For a regression model, R2 is the effect size: the share of the variance of the criterion variable explained by the predictors. Here R2 = 0.24 (adjusted R2 = 0.21). It can also be expressed as Cohen’s f2 = R2 / (1 - R2), for which values around .02 indicate a small effect, .15 a medium effect, and .35 a large effect. Here f2 = 0.32, a medium effect. A significant model with a medium effect can still leave most of the variance unexplained, as the rest of the analysis shows.
A full ANOVA table for the regression model may help understand it a bit further.
Analysis of Variance Table

Response: BuyRaw
           Df  Sum Sq Mean Sq F value    Pr(>F)
Price       1   57.34   57.34  7.4909  0.006834 **
Quality     1  334.72  334.72 43.7255 4.308e-10 ***
Taste       1    0.35    0.35  0.0456  0.831159
LocGrown    1   11.64   11.64  1.5212  0.219077
PrepEase    1    5.43    5.43  0.7093  0.400797
Nutrition   1   17.39   17.39  2.2713  0.133575
Residuals 177 1354.95    7.66
---
Signif. codes:  0 '***' 0.001 '**' 0.01 '*' 0.05 '.' 0.1 ' ' 1
An analysis of the full ANOVA table3131 As a reminder, total variance is the sum of two variances: the variance due to the predictors (model) and the variance due to error. In the ANOVA output it is represented by the sum of squares (column “Sum Sq”). The value for each variable indicates the variance accounted for by the respective predictor. The “Residuals” line at the bottom lists the unexplained (error) variance. suggests Price as being a significant predictor besides Quality. Looking at the last column of the table, the p-values for each of the predictor variables are different from those listed in the regression analysis output. The differences are indicative of overlap between the predictors which is an indication that the variables are not perfectly uncorrelated. The largest differences are observed for the two variables in question3232 Common sense tells us that usually quality is correlated with price in the sense that higher quality usually demands higher prices while higher prices many not necessarily mean higher quality.. Considering that the standardized coefficient of the Quality predictor is clearly larger than the one of the Price predictor, Quality is probably more relevant than price in this analysis.
31 As a reminder, total variance is the sum of two variances: the variance due to the predictors (model) and the variance due to error. In the ANOVA output it is represented by the sum of squares (column “Sum Sq”). The value for each variable indicates the variance accounted for by the respective predictor. The “Residuals” line at the bottom lists the unexplained (error) variance.
32 Common sense tells us that usually quality is correlated with price in the sense that higher quality usually demands higher prices while higher prices many not necessarily mean higher quality.
The variance inflation factor (VIF)3333 When multicollinearity exists, the standard errors of the coefficients of the regression equation are inflated, so the coefficients are estimated less precisely. VIF is a measure of how much the variance is inflated due to multicollinearity. can be used to study predictor multicollinearity3434 Multicollinearity happens when two or more predictors are correlated with each other. It occurs in many studies, especially when the researchers only observe a process and do not have control over the variables. Significant multicollinearity can also be an indication of potential issues with the instrument used to collect the data. among predictors. The higher the value of the VIF is, the more significant the collinearity. The VIF values for the current model are listed below.
33 When multicollinearity exists, the standard errors of the coefficients of the regression equation are inflated, so the coefficients are estimated less precisely. VIF is a measure of how much the variance is inflated due to multicollinearity.
34 Multicollinearity happens when two or more predictors are correlated with each other. It occurs in many studies, especially when the researchers only observe a process and do not have control over the variables. Significant multicollinearity can also be an indication of potential issues with the instrument used to collect the data.
    Price   Quality     Taste  LocGrown  PrepEase Nutrition
 1.542454  6.309501  6.200920  2.006576  3.059305  3.378673
There are multiple ways to interpret the results in this output One way would be to analyze the raw VIF values and flag those with values greater then 10. The output indicates that all model predictors respect the collinearity assumption.
Another way is to compute square root of the VIF values and flag those with values greater then 2 as having collinearity issues (output of running this computation is included below). The output below flags Quality and Taste as being collinear.
    Price   Quality     Taste  LocGrown  PrepEase Nutrition
    FALSE      TRUE      TRUE     FALSE     FALSE     FALSE
Given that there is no agreement in the analysis, alternative models3535 For example, forward and backward stepwise regression models., discussed in the next sections, could be helpful in bringing some clarity to these issues.
35 For example, forward and backward stepwise regression models.
With a 24.0% explanatory power this model is not capable of explaining much of the criterion variable variability using a linear combination of all predictor variable even though the model is significant overall.
As the model output suggests any prediction made using this model will be relatively weak. Further analysis suggests that the model’s predictors share a lot of explanatory power with overlapping and collinearity being the main issues. Additional models can be useful in understanding if different, more parsimonious3636 With fewer predictors. models, can explain a larger percentage of the variance of the criterion variable.
36 With fewer predictors.
21.9 Hierarchical Regression
At a glance
- Question
- Does a set of predictors add to the prediction made by another set?
- Design
- Predictors entered in steps, in an order set by theory before the analysis
- Criterion
- Interval or ratio
- Predictors
- Two or more sets
- Assumptions
-
- The assumptions of multiple regression
- The order of the steps is decided before looking at the results
- Null hypothesis
- The added predictors explain no additional variance (\Delta R^{2} = 0)
- Test statistic
- F for the change in R2
- Effect size
- \Delta R^{2}, the variance added by each step
- Include in the write-up
-
- The predictors entered at each step, and why
- R2 for each step, and \Delta R^{2} with F(df1, df2) = …, p = …
In hierarchical regression, the predictors are entered in blocks, in an order decided by the researcher, based on theory or on the purpose of the study3737 Not to be confused with hierarchical linear models, another name for the multilevel models used for nested data.. Each block is a new model that includes all the predictors of the previous models. The question asked at each step is: do the new predictors explain a significant part of the variance of the criterion, over and above the predictors already in the model?
37 Not to be confused with hierarchical linear models, another name for the multilevel models used for nested data.
Hierarchical regression is often used to:
- Control for variables known to affect the criterion, such as demographic characteristics, by entering them first, and then test whether the variables of interest add to the prediction;
- Test whether a group of related predictors, taken together, adds to the model;
- Test theories that order the predictors, such as more distant causes before closer ones.
Two models are nested when one includes all the predictors of the other and more. Nested models are compared by the increase in R^2 (\Delta R^2) brought by the new predictors, which is tested with an F test:
F = \frac{(R^2_{2} - R^2_{1}) / (k_{2} - k_{1})}{(1 - R^2_{2}) / (n - k_{2} - 1)}
where the indices 1 and 2 refer to the smaller and the larger model, and k is the number of predictors of each.
For the nut study, the six predictors can be divided into two groups. Price, Quality, and Taste describe the product itself. LocGrown, PrepEase, and Nutrition describe other considerations: where the product comes from, how easy it is to prepare, and its health value. The researchers wanted to know whether the second group of considerations adds anything to the product characteristics.
Hypotheses. H0: In the population, the other considerations add nothing to the prediction of the interest in buying raw nuts once the product characteristics are known (\Delta R^2 = 0). H1: They add to the prediction (\Delta R^2 > 0).
Decision criteria. \alpha = .05. H0 is rejected if the p-value of the F test comparing the two models is smaller than \alpha. The effect size is \Delta R^2.
Analysis of Variance Table

Model 1: BuyRaw ~ Price + Quality + Taste
Model 2: BuyRaw ~ Price + Quality + Taste + LocGrown + PrepEase + Nutrition
  Res.Df    RSS Df Sum of Sq      F Pr(>F)
1    180 1389.4
2    177 1355.0  3    34.462 1.5006 0.2161
Decision. The product characteristics, entered in the first step, explain 22% of the variance in the interest in buying raw nuts, R^2 = 0.22, F(3, 180) = 16.95, p < .001. The other considerations, added in the second step, increase R^2 by only 0.019, a change that is not significant, F(3, 177) = 1.50, p = .216. H0 cannot be rejected.
Effect size. \Delta R^2 = 0.019. Once the participants’ views about price, quality, and taste are known, their views about where the nuts are grown, how easy they are to prepare, and their nutritional value add about 2% to the explained variance.
The results of a hierarchical regression are usually reported in a table with one block of rows for each step (Table 21.8).
| Predictor | b | SE | β | p |
|---|---|---|---|---|
| Step 1 (R2 = .22) | ||||
| Price | -0.084 | 0.092 | -.07 | .363 |
| Quality | 0.565 | 0.170 | .53 | .001 |
| Taste | -0.036 | 0.168 | -.03 | .832 |
| Step 2 (ΔR2 = .019) | ||||
| Price | -0.061 | 0.098 | -.05 | .536 |
| Quality | 0.474 | 0.175 | .44 | .008 |
| Taste | -0.040 | 0.174 | -.04 | .817 |
| LocGrown | 0.091 | 0.089 | .09 | .310 |
| PrepEase | -0.172 | 0.118 | -.17 | .145 |
| Nutrition | 0.163 | 0.108 | .18 | .134 |
A hierarchical regression examined the interest in buying raw nuts (N = 184). The product characteristics (price, quality, and taste), entered in the first step, explained a significant part of the variance, R2 = .22, F(3, 180) = 16.95, p < .001. Adding local origin, ease of preparation, and nutrition in the second step did not improve the prediction significantly, ΔR2 = .019, F(3, 177) = 1.50, p = .216.
Of note is the fact that the order of the steps matters when the predictors are correlated. Variance shared by predictors from both blocks is credited to the block entered first. Entering the other considerations first would credit them with the variance they share with the product characteristics, and the conclusion could change. The order must therefore be decided before the analysis, from theory, and reported.
21.10 Backward Model
As an example, let’s run a backward stepwise regression to see if a more parsimonious model exists and how that model might look like. In backward stepwise regression the analysis starts with the most complex model, which includes all predictors. It then starts to build new models by removing predictors in reverse order of their partial correlations with the criterion variable. This process continues until removing another predictor no longer improves the model3838 The goodness of fit of an estimated statistical model is measured by either the Akaike’s Information Criterion (AIC) or the Bayesian Information Criterion (BIC). The lower the value or AIC or BIC is, the better the model is. Therefore, stepwise regression will compute a value for the AIC or BIC for each successive regression model and compare it with the one computed for the preceding model. If the value is lower, meaning a better fit of the model, the model is retained. Otherwise, the analysis is stopped and the last retained model is considered to be the best fit. A lower AIC is not a significant difference: AIC is not a test.. The predictors are being considered one by one to determine their effect when removed from the regression equation. The predictor whose deletion brings the smallest reduction in R2 is the candidate for removal in the next iteration..
38 The goodness of fit of an estimated statistical model is measured by either the Akaike’s Information Criterion (AIC) or the Bayesian Information Criterion (BIC). The lower the value or AIC or BIC is, the better the model is. Therefore, stepwise regression will compute a value for the AIC or BIC for each successive regression model and compare it with the one computed for the preceding model. If the value is lower, meaning a better fit of the model, the model is retained. Otherwise, the analysis is stopped and the last retained model is considered to be the best fit. A lower AIC is not a significant difference: AIC is not a test.
Start:  AIC=381.37
BuyRaw ~ Price + Quality + Taste + LocGrown + PrepEase + Nutrition

            Df Sum of Sq    RSS    AIC
- Taste      1     0.413 1355.4 379.43
- Price      1     2.939 1357.9 379.77
- LocGrown   1     7.930 1362.9 380.45
<none>                   1355.0 381.37
- PrepEase   1    16.379 1371.3 381.58
- Nutrition  1    17.387 1372.3 381.72
- Quality    1    55.824 1410.8 386.80

Step:  AIC=379.43
BuyRaw ~ Price + Quality + LocGrown + PrepEase + Nutrition

            Df Sum of Sq    RSS    AIC
- Price      1     2.903 1358.3 377.82
- LocGrown   1     7.825 1363.2 378.49
<none>                   1355.4 379.43
- Nutrition  1    17.251 1372.6 379.75
- PrepEase   1    17.927 1373.3 379.85
- Quality    1   135.781 1491.1 394.99

Step:  AIC=377.82
BuyRaw ~ Quality + LocGrown + PrepEase + Nutrition

            Df Sum of Sq    RSS    AIC
- LocGrown   1     8.793 1367.1 377.01
<none>                   1358.3 377.82
- Nutrition  1    17.237 1375.5 378.14
- PrepEase   1    25.264 1383.5 379.21
- Quality    1   134.178 1492.4 393.16

Step:  AIC=377.01
BuyRaw ~ Quality + PrepEase + Nutrition

            Df Sum of Sq    RSS    AIC
<none>                   1367.1 377.01
- PrepEase   1    20.476 1387.5 377.74
- Nutrition  1    26.231 1393.3 378.51
- Quality    1   154.246 1521.3 394.68
Call:
lm(formula = BuyRaw ~ Quality + PrepEase + Nutrition, data = my.chestnut)

Residuals:
    Min      1Q  Median      3Q     Max
-7.7792 -1.8192  0.2208  1.8420  6.0019

Coefficients:
            Estimate Std. Error t value Pr(>|t|)
(Intercept)  3.82644    0.84584   4.524 1.10e-05 ***
Quality      0.44700    0.09919   4.507 1.18e-05 ***
PrepEase    -0.17635    0.10741  -1.642   0.1023
Nutrition    0.19287    0.10378   1.858   0.0647 .
---
Signif. codes:  0 '***' 0.001 '**' 0.01 '*' 0.05 '.' 0.1 ' ' 1

Residual standard error: 2.756 on 180 degrees of freedom
Multiple R-squared:  0.2328,    Adjusted R-squared:   0.22
F-statistic:  18.2 on 3 and 180 DF,  p-value: 2.32e-10
The output above shows a trace of the successive models considered in the analysis. It starts with the full model3939 The predictors are sorted in ascending order of their contribution to the total variance, represented by the “Sum of Sq” column. and continues to remove the predictor with the smallest contribution to the variance until removing another predictor no longer lowers the AIC. The criteria used is AIC, listed at the top of each iteration. In this case, by using backward stepwise regression we were able to slightly improve the predictive power of the model by using only three of the predictors: Quality, PrepEase, and Nutrition. Model summary shows that the adjusted R2, which takes the number of predictors into account, increased to 22.0% (from 21.4% for the full model). Of note is the fact that the p-values in the summary of the selected model are too small: they do not take into account that the predictors were selected from the same data. The selected model should be confirmed on new data before it is trusted.
39 The predictors are sorted in ascending order of their contribution to the total variance, represented by the “Sum of Sq” column.
21.11 Summary
The study exemplified here was designed as an exploratory study. For that reason any outcome was expected despite the fact that the researchers believed, based on existing literature, that the six predictor variables would be fairly reliable in explaining consumers’ level of interest in buying raw products.
The multiple linear regression analysis has produced weak models, explaining at most 24% of the variance of the criterion. The hierarchical regression showed that most of this comes from the product characteristics, price, quality, and taste. During the analysis it became evident that predictor collinearity and overlapping seems to be a significant issue with this analysis. Stepwise regression was able to offer a more parsimonious model, to be confirmed in a future study, although the 0.6 percentage point increase in adjusted R2 is too small to be meaningful in real life. None of the cases had a large influence on the results.
The results of the analysis seem to suggest that the study’s design was flawed and that the current data does not have sufficient potential to explain market behavior and cannot be used as predictor for future behavior. Nevertheless, it has provided the foundation for further studies using a revised data collection instrument.